Transcriptomics, Immune Repertoire (TCR & BCR), Cell surface proteins and Epigenetics
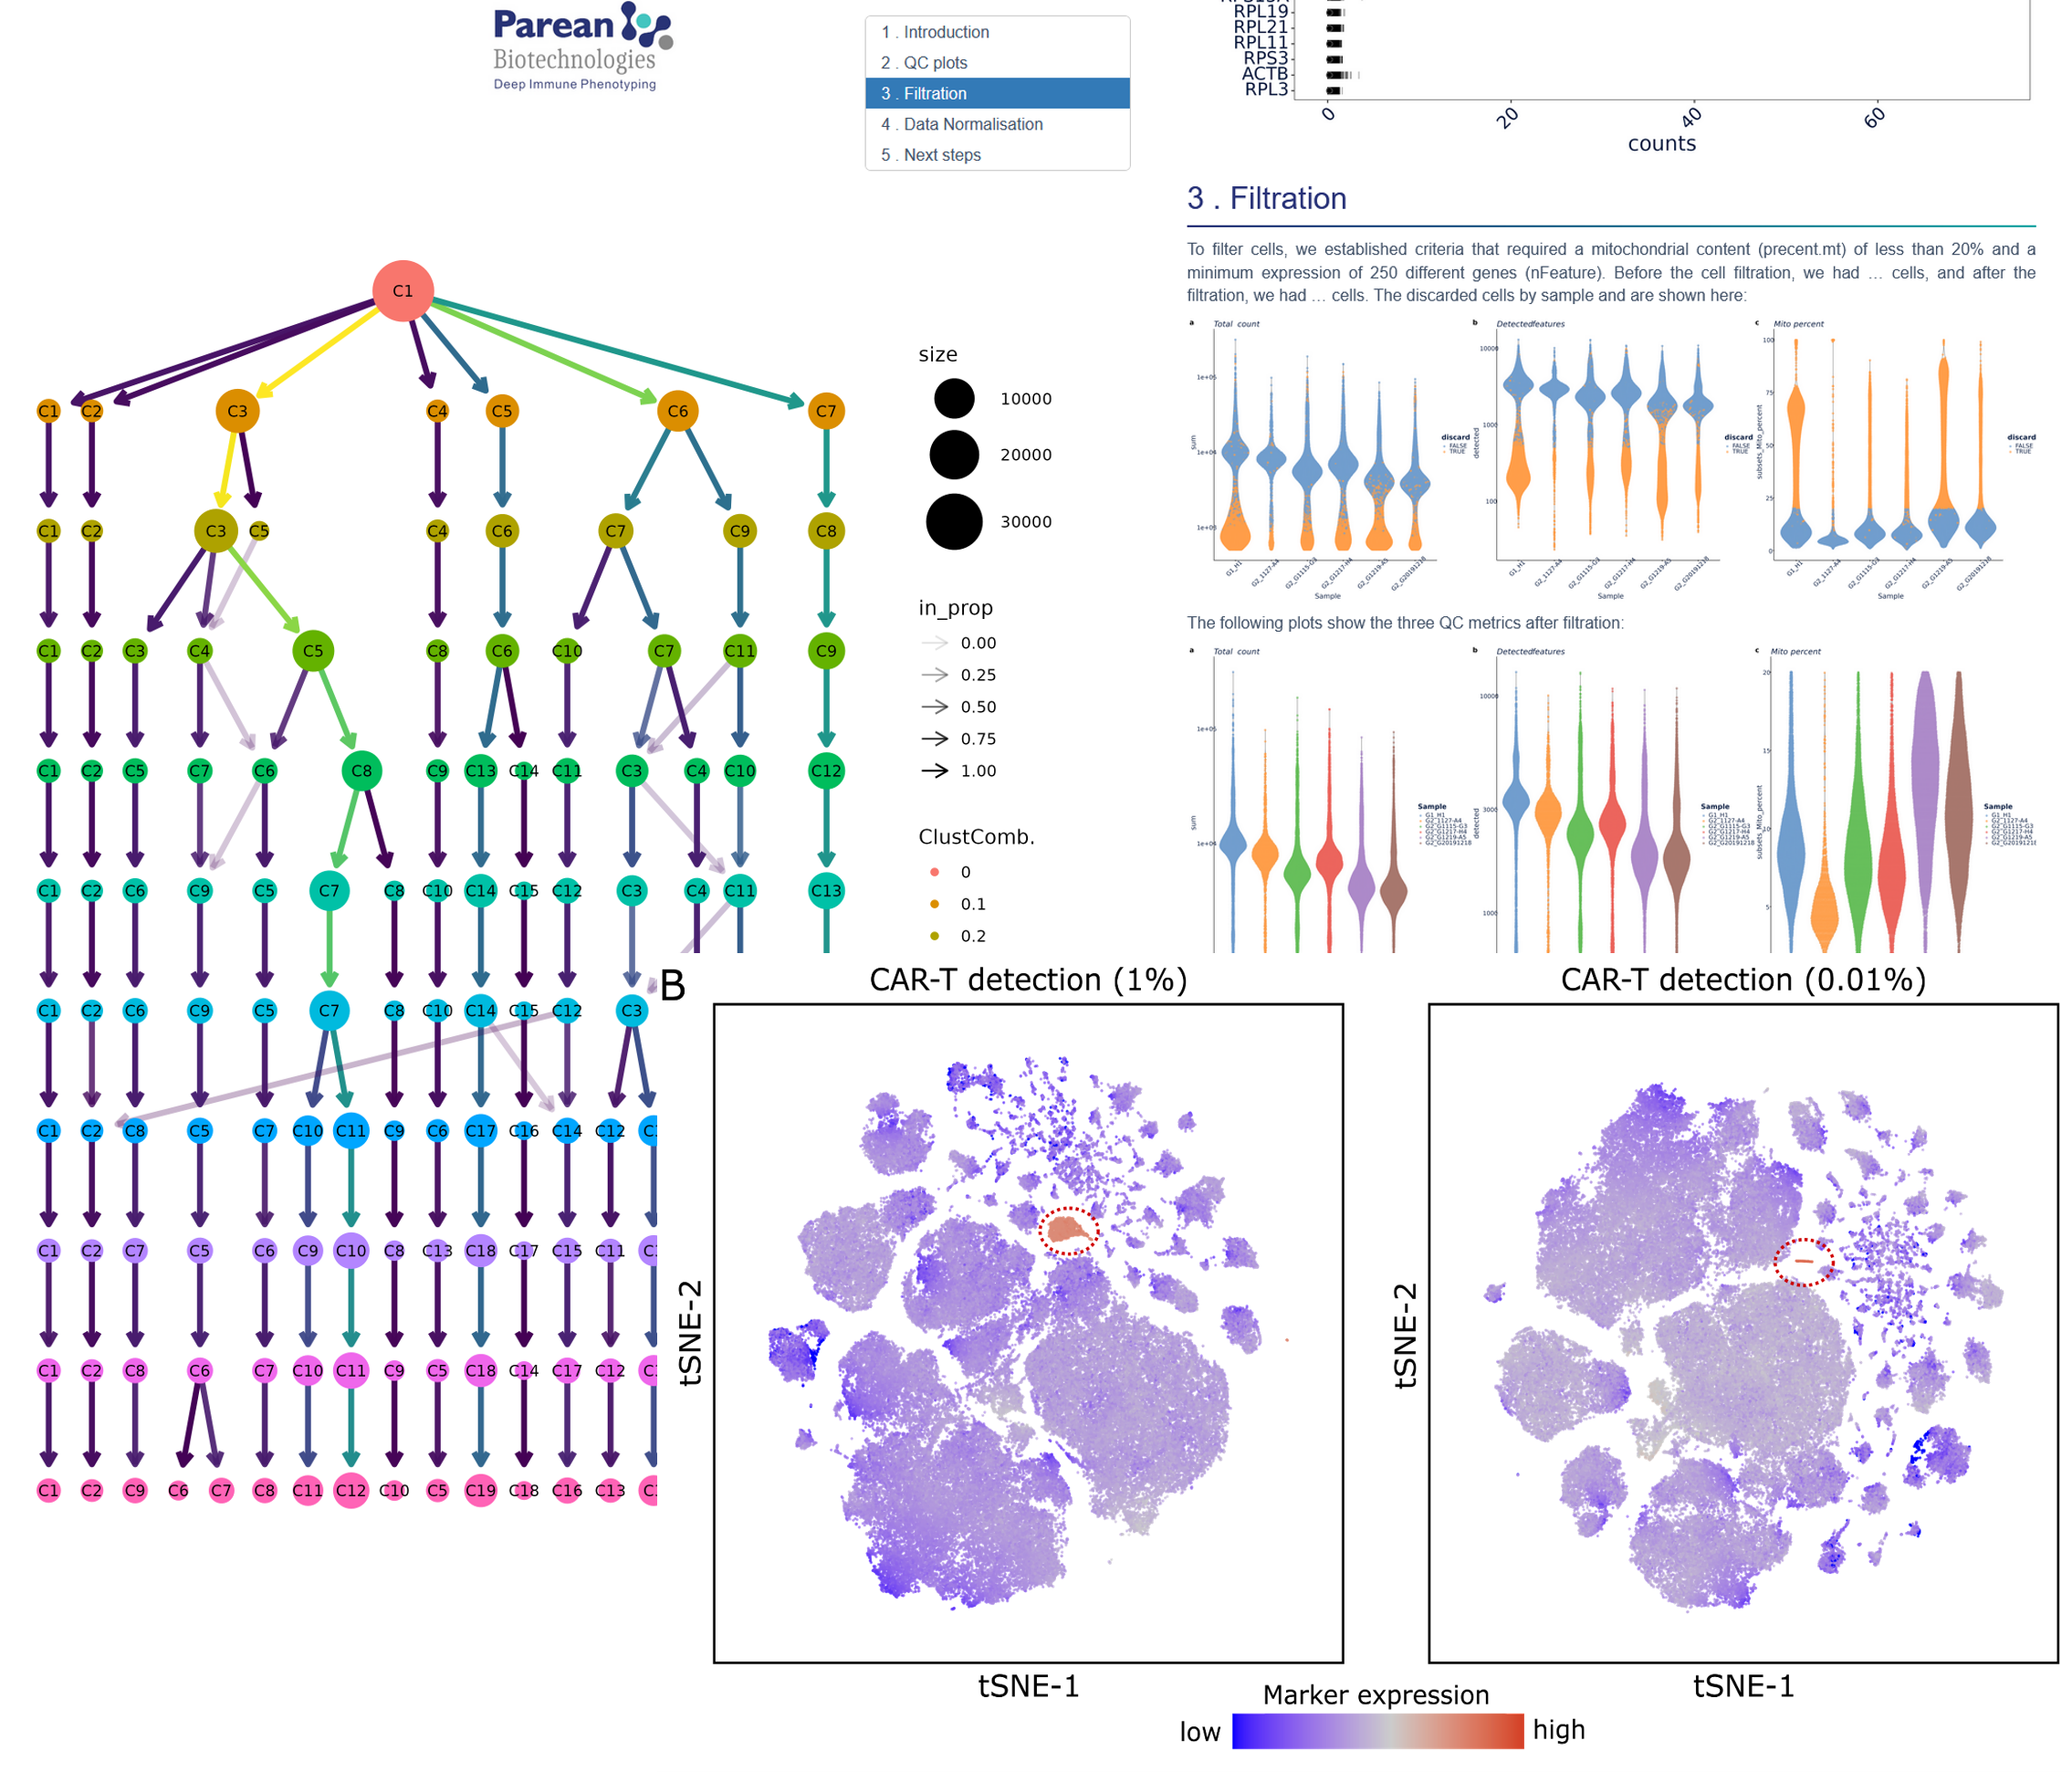
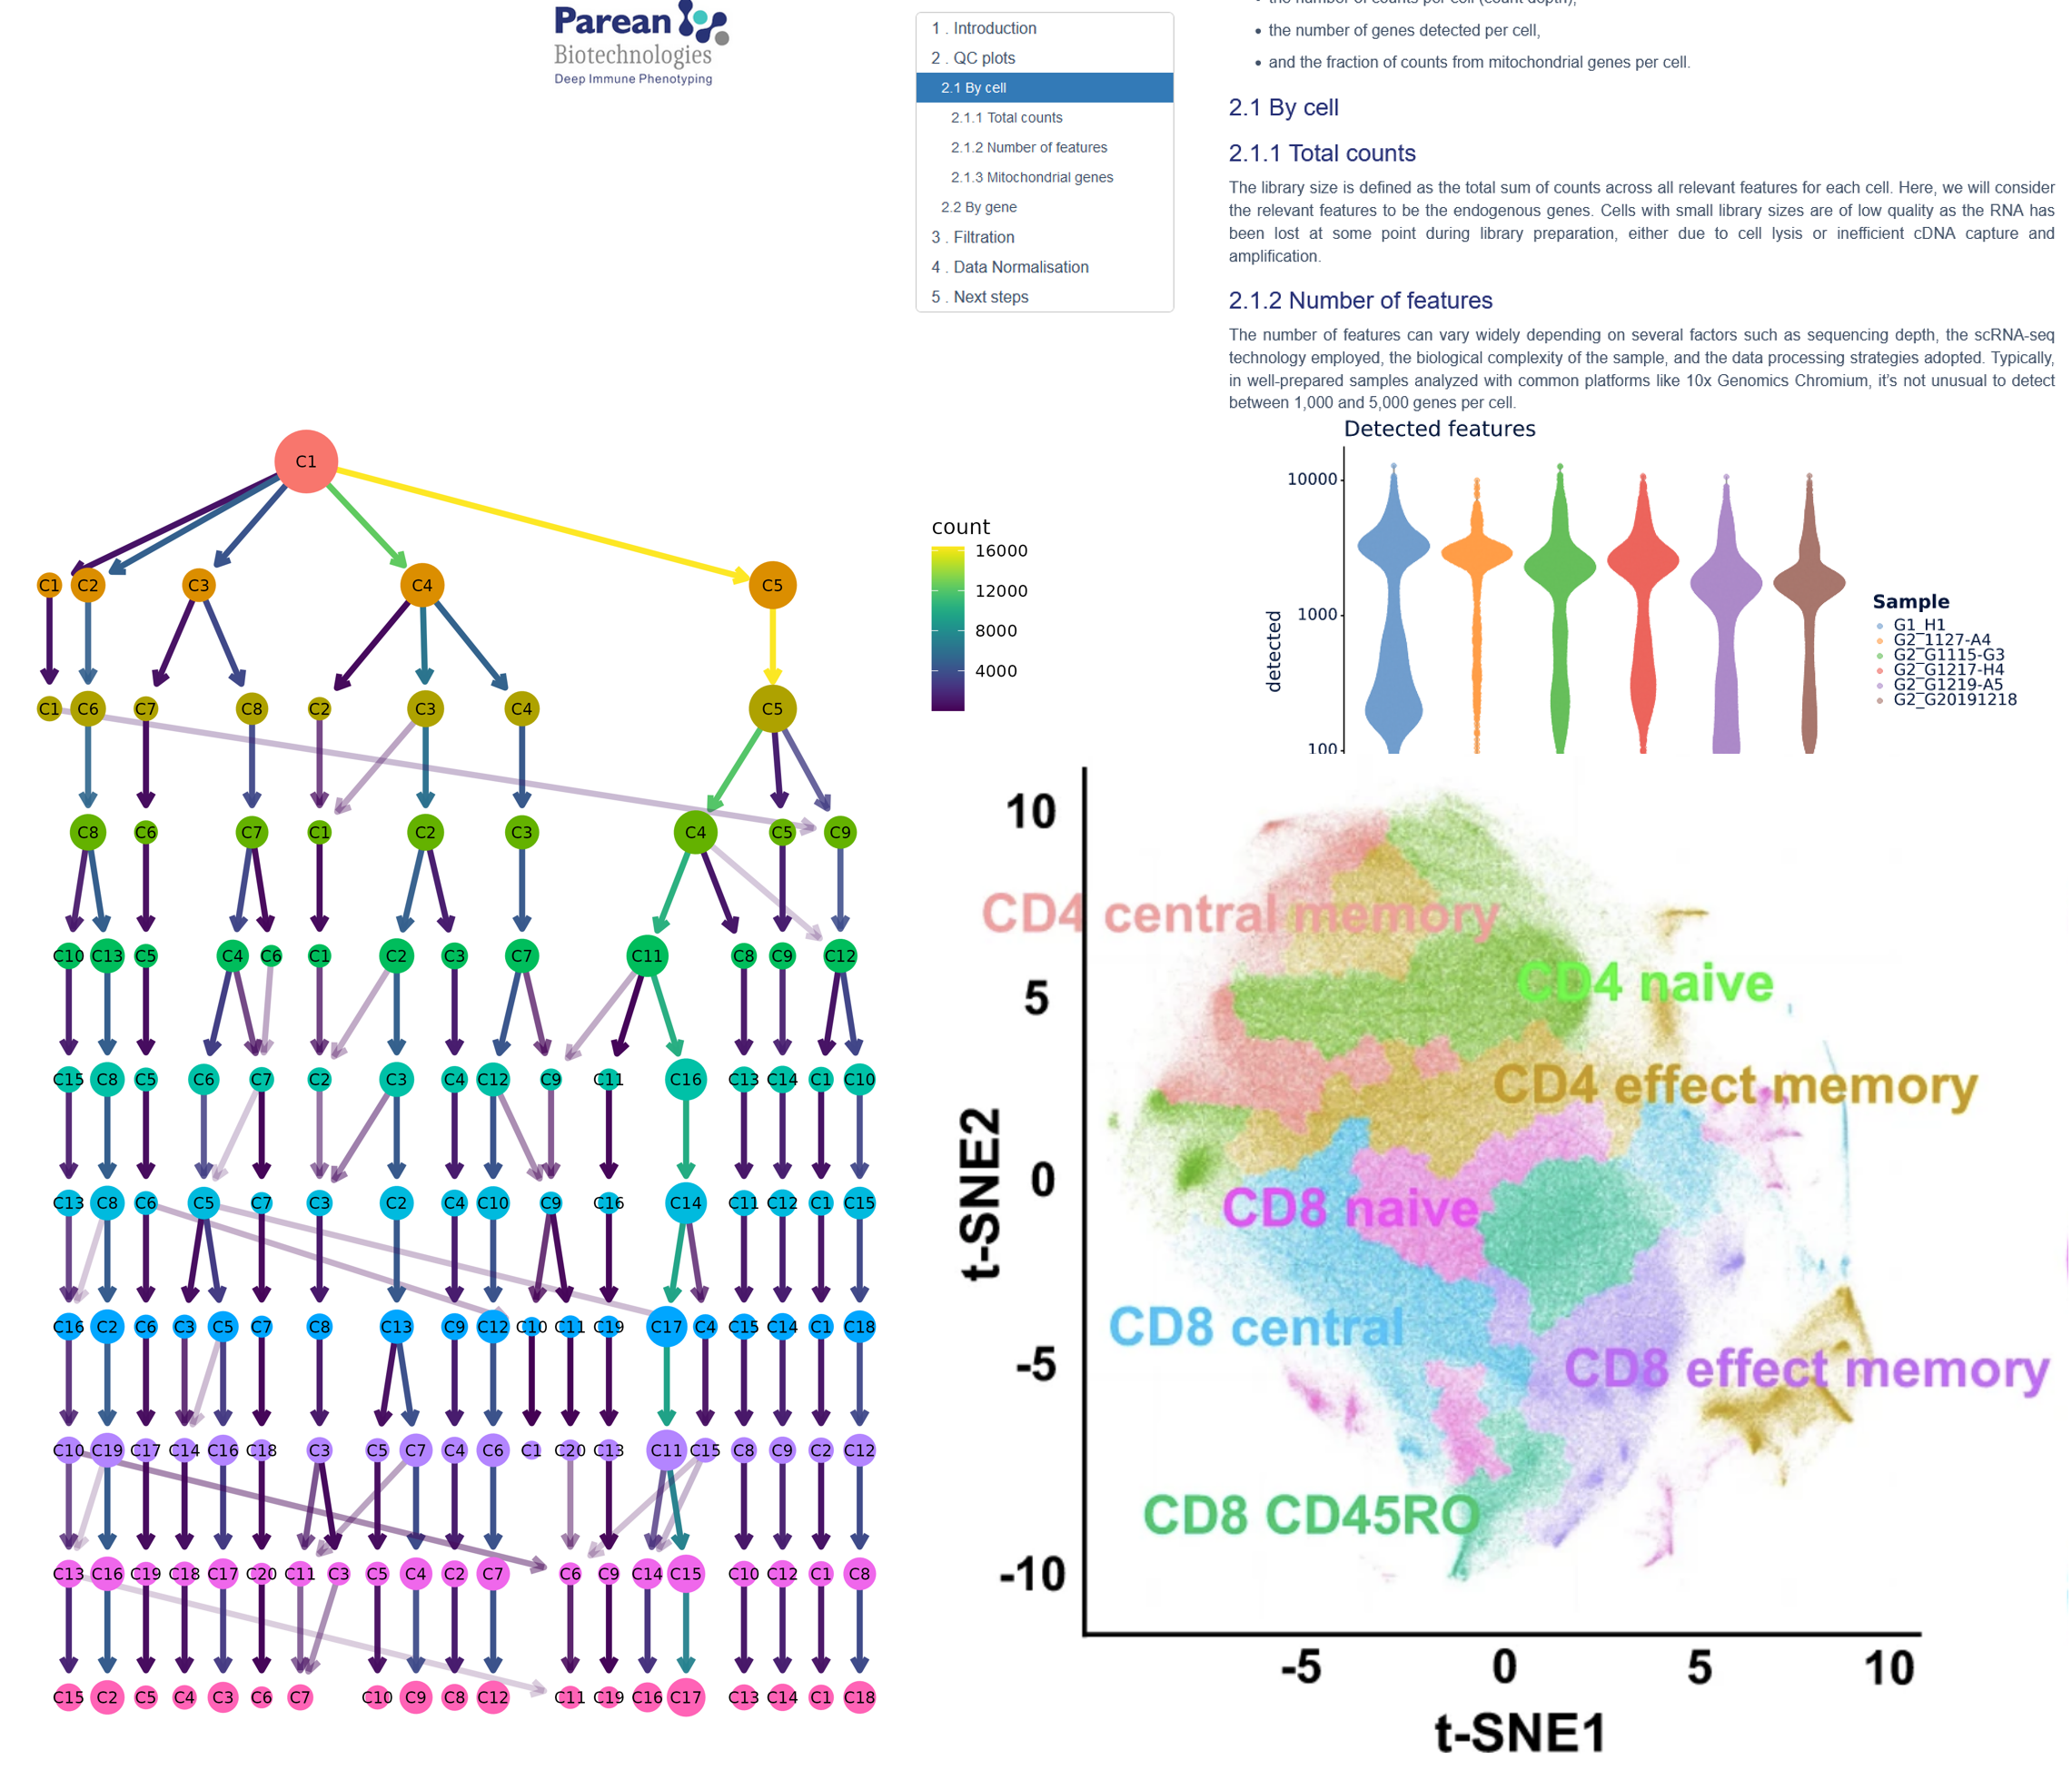
We provide the latest, most robust, and actionable pipelines for QC, filtration, normalization or dimension reduction (PCA, t-SNE, UMAP..)

QC, Trimming if necessary, trimmed data QC. Alignment of data scRNA-Seq with the latest reference genome, Count data QC.
Deliverables
Fastq – QC reports – Filtered data.
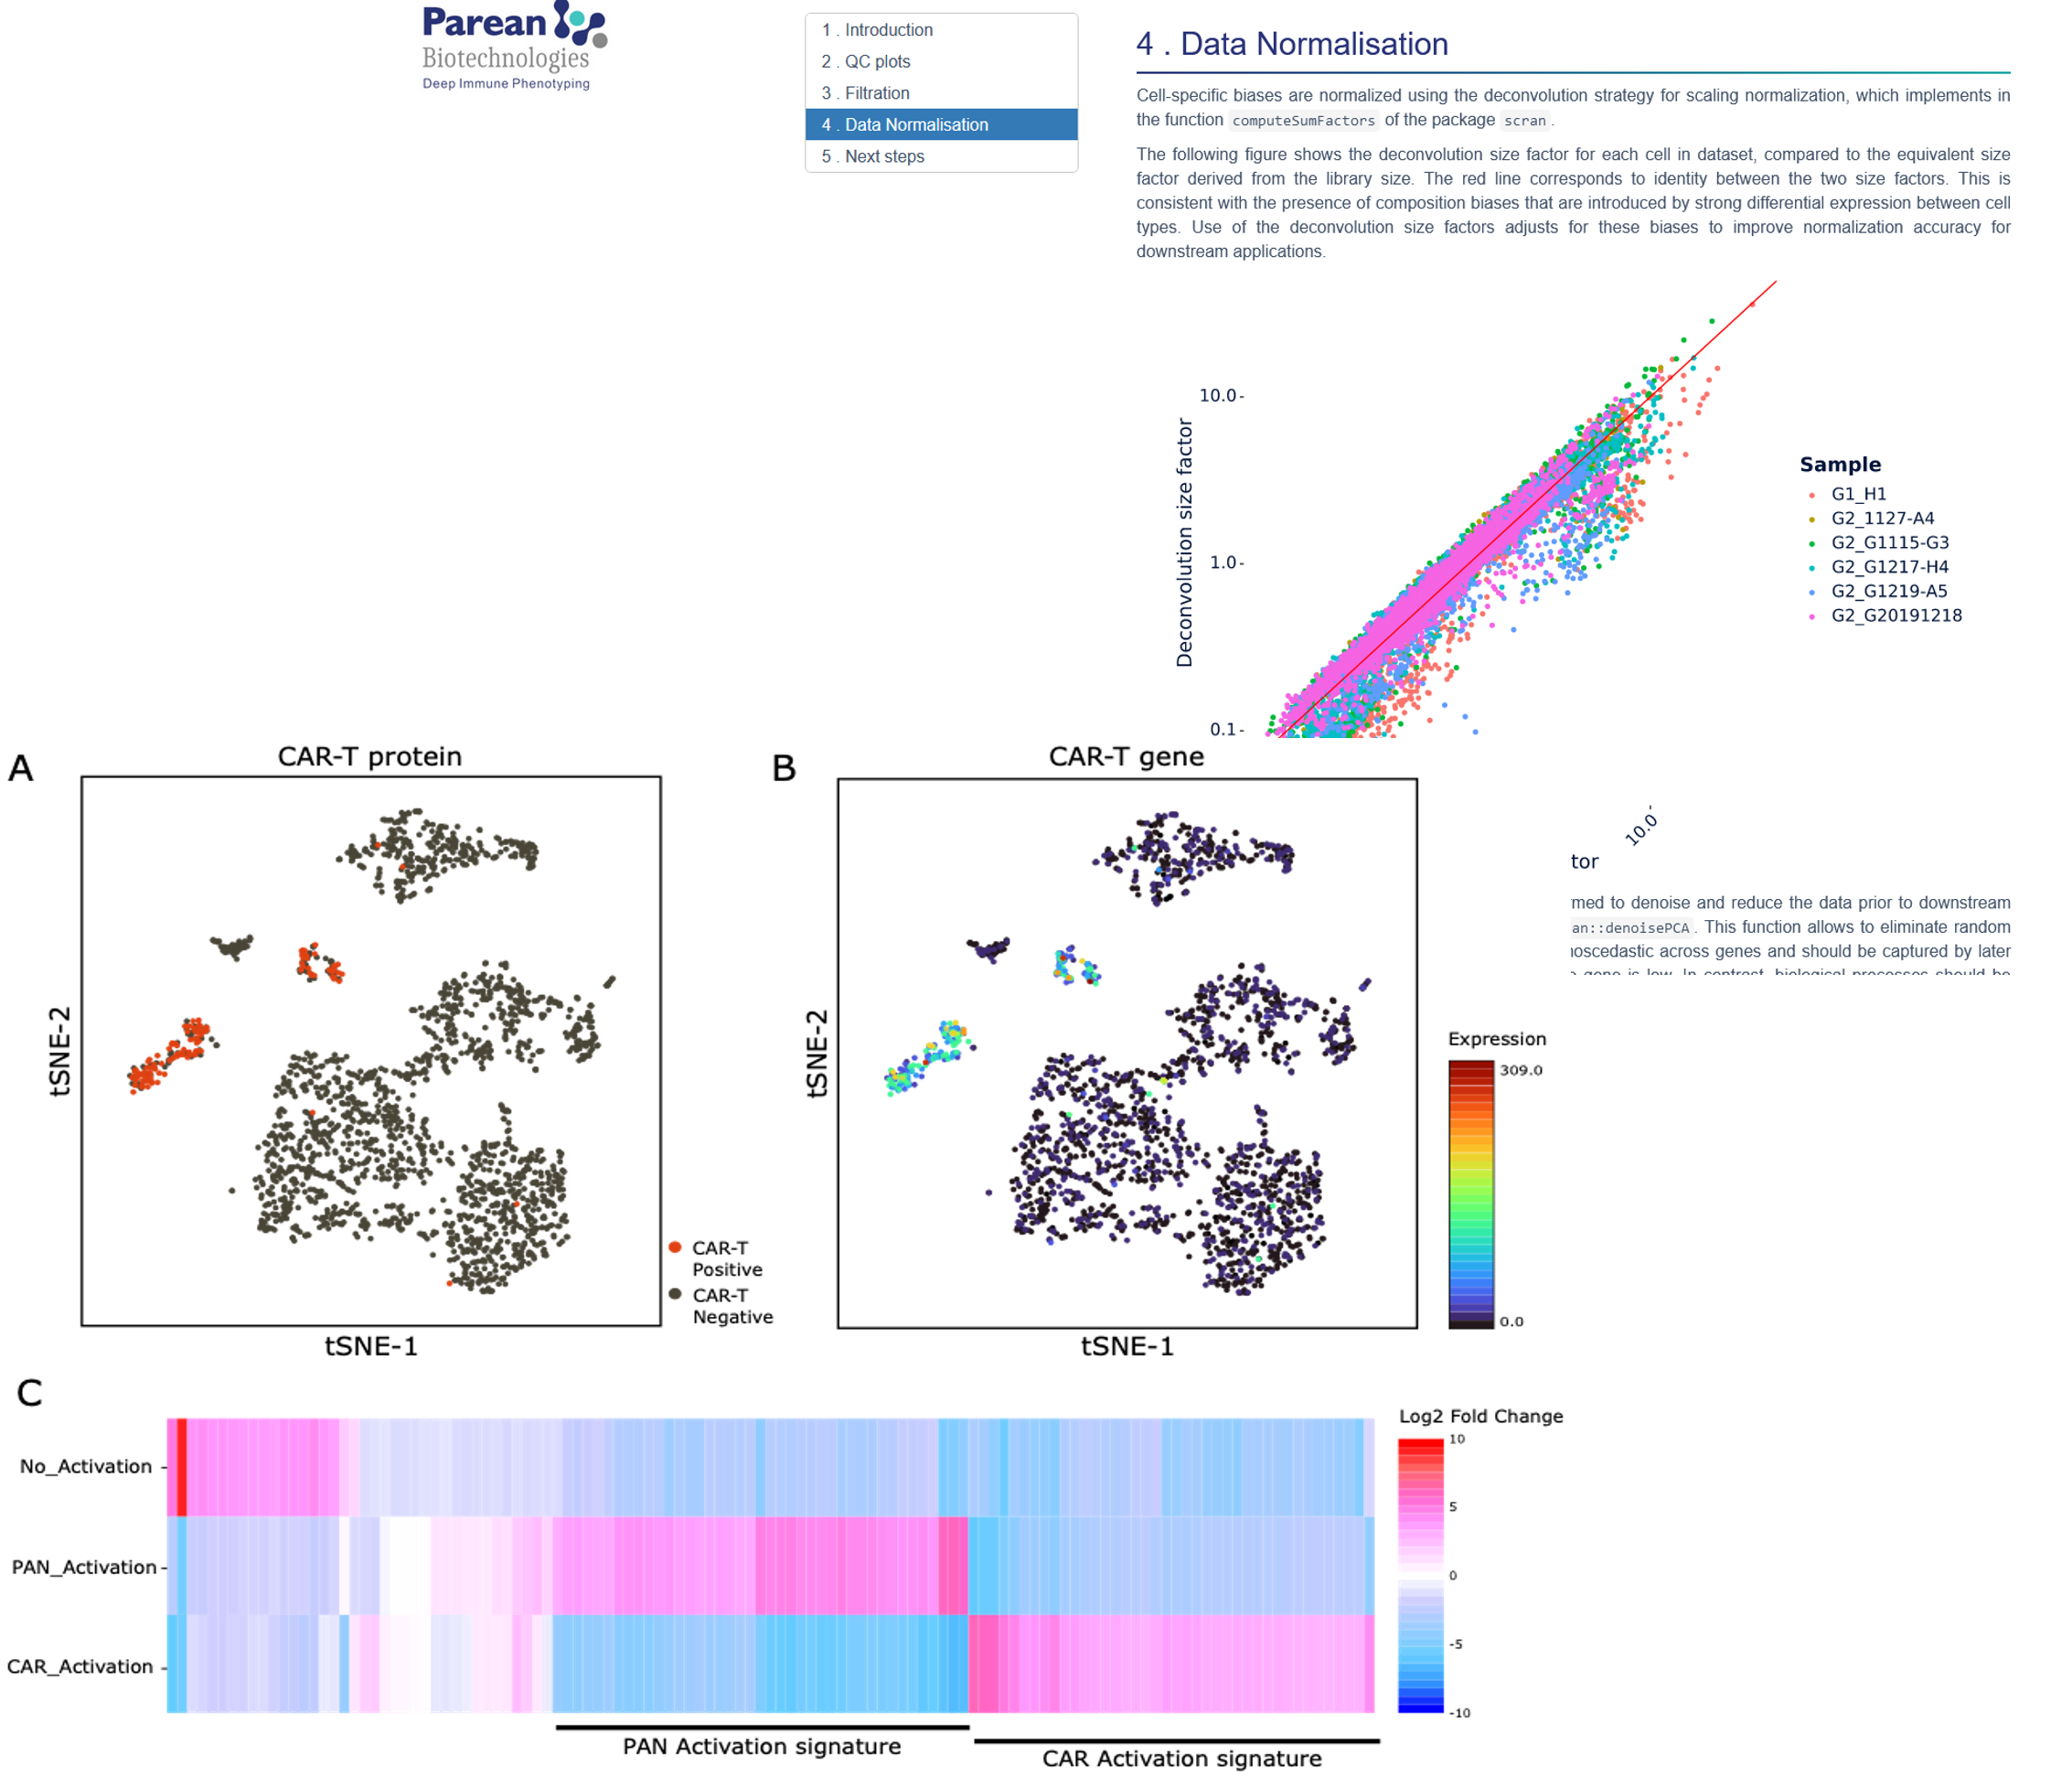
Normalization, Gene Selection, Dimension reduction. (Advance calculation of the PCA, t-SNE and UMAP axes)
Deliverables
Bioinformatics object (e.g. Seurat, SingleCellExperiment, …) including counting data, normalized data, and reduction dimensions.
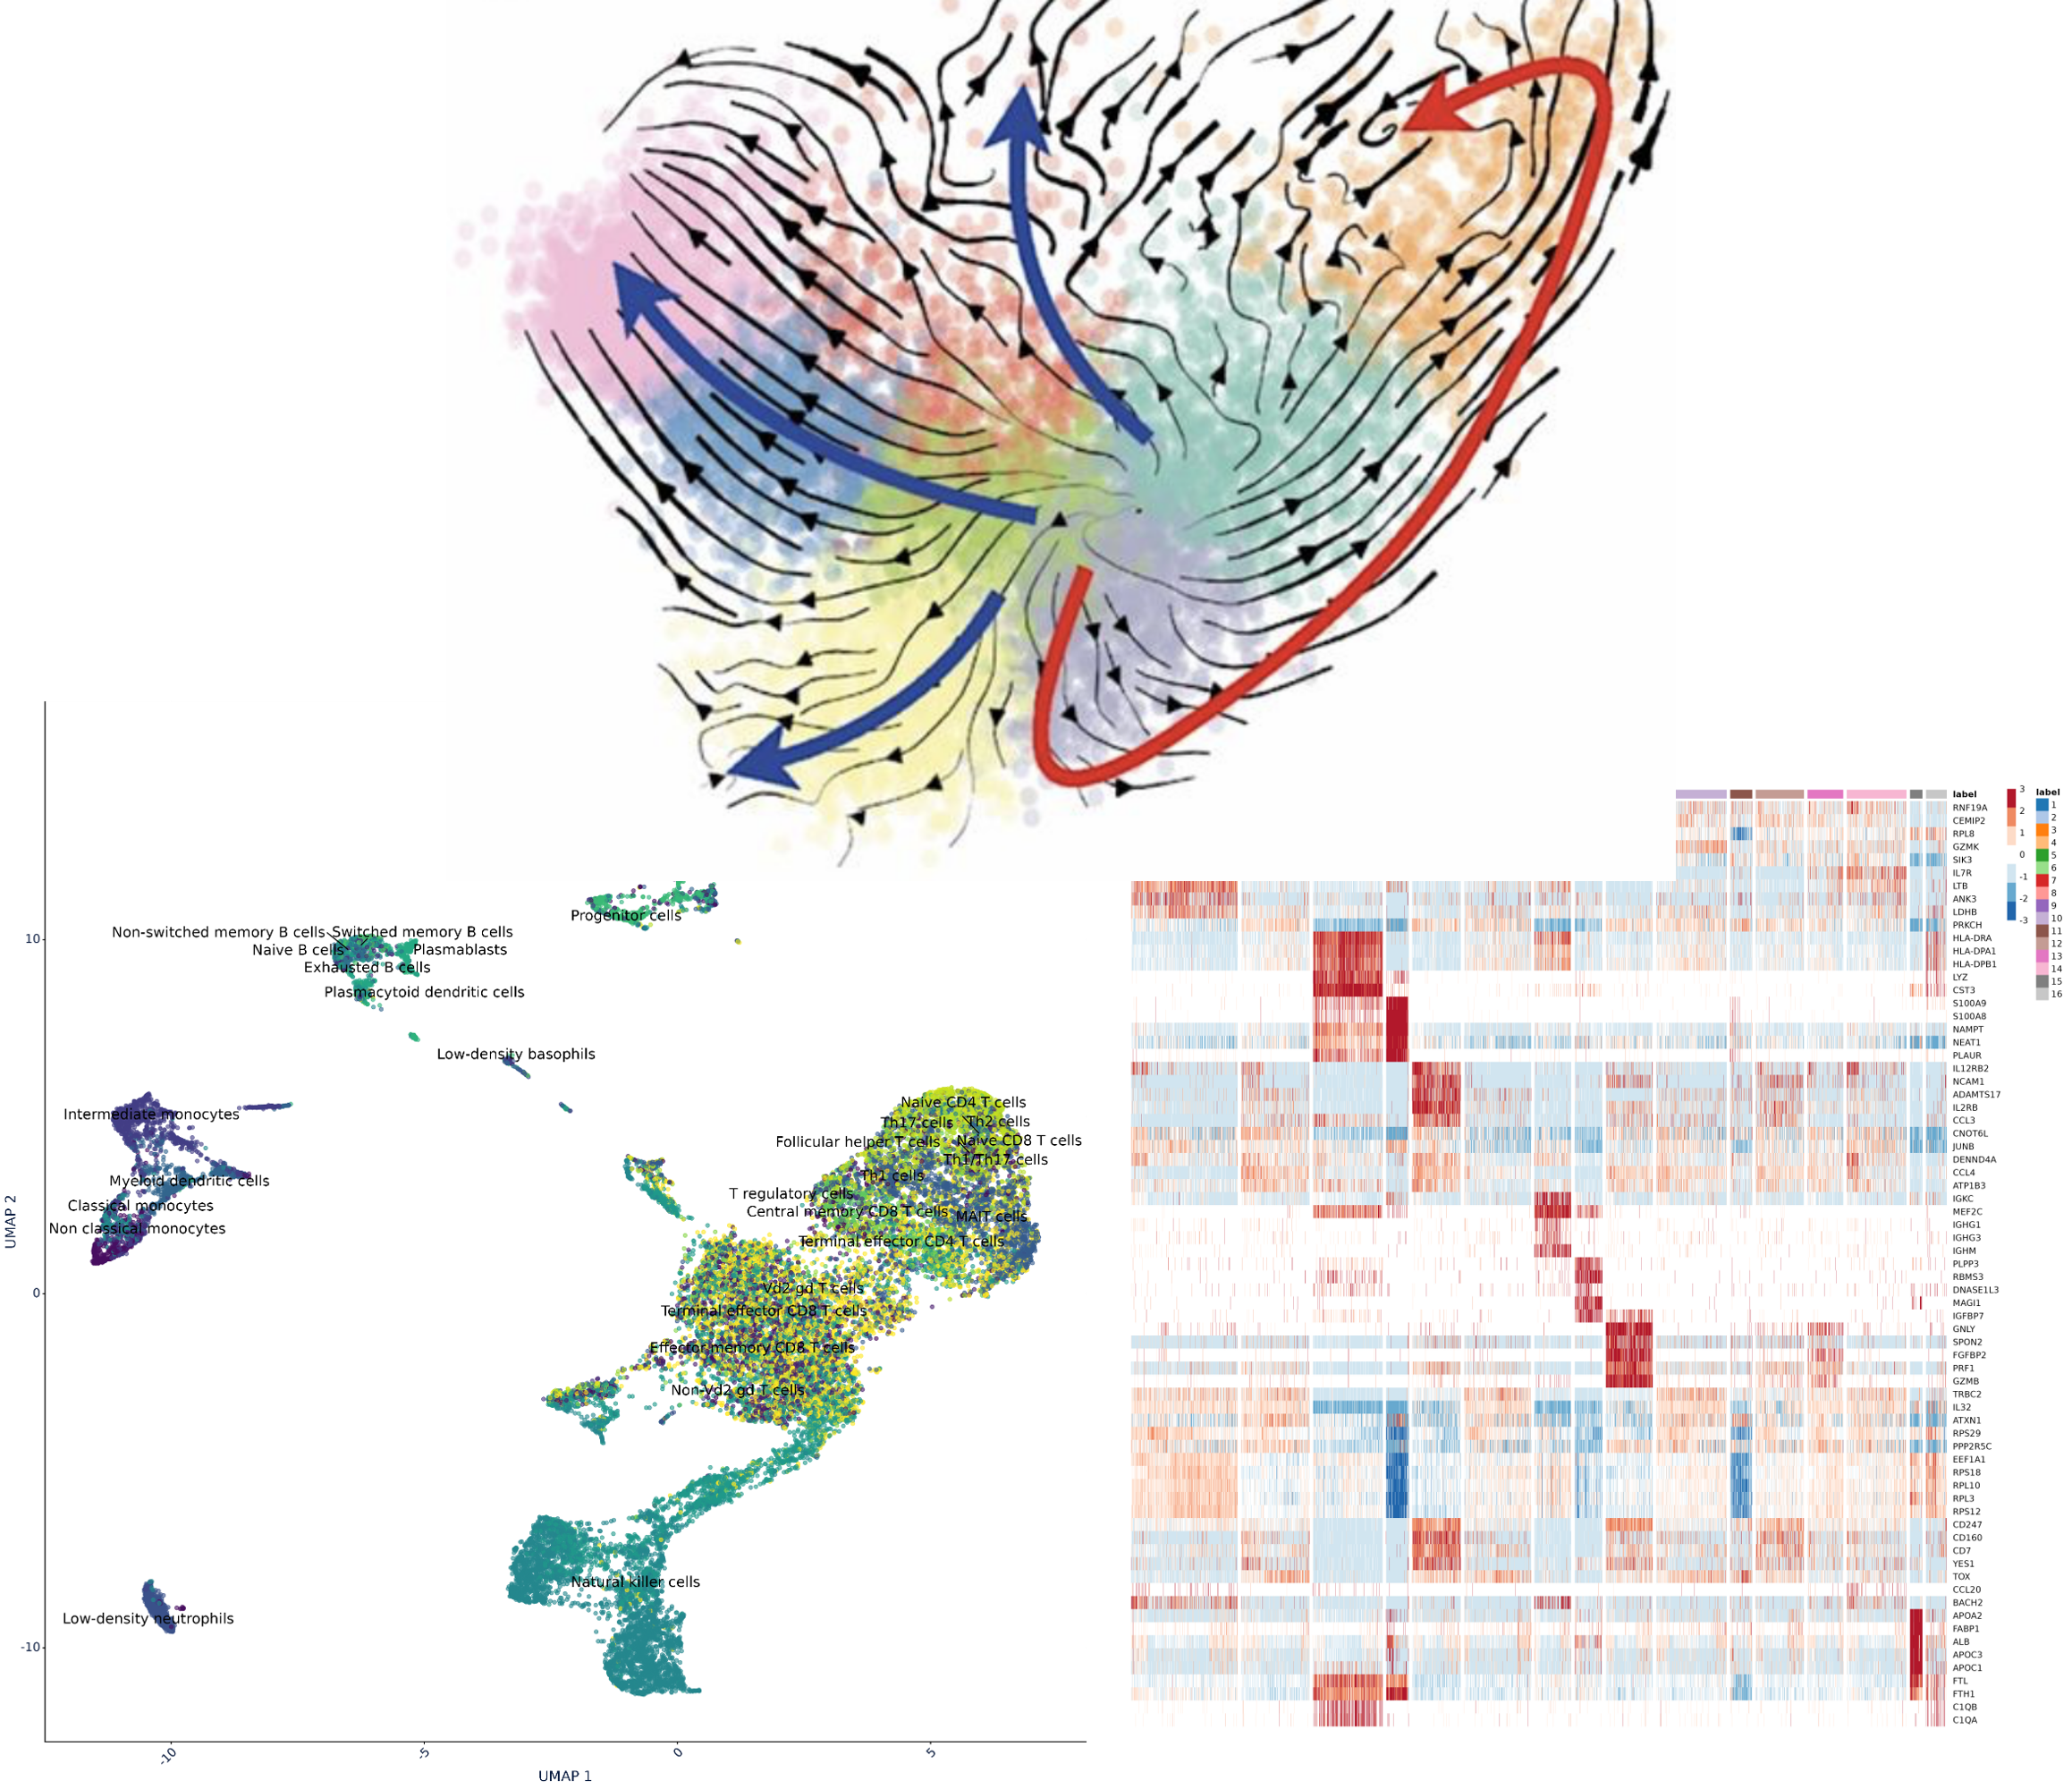
Cell analysis, differential tests, ORA, cluster annotation with you and full graphical representation for your exploratory analysis.
Deliverables
Bioinformatics object, complemented by the analyses listed above and their relevant graphical representations.
We master TCR & BCR at single cell level. Use our pipeline for descriptive diversity profils, spectra typing analysis, repertoire sharing, and much more..
Deliverables
FastQ – QC reports – Filtered data in MiAIRR format.
Deliverables
Bioinformatics object (e.g. Seurat, SingleCellExperiment, …), including counting, normalized, integrated sample data, and reduction dimensions, with graphs & analysis and meeting with our teams.
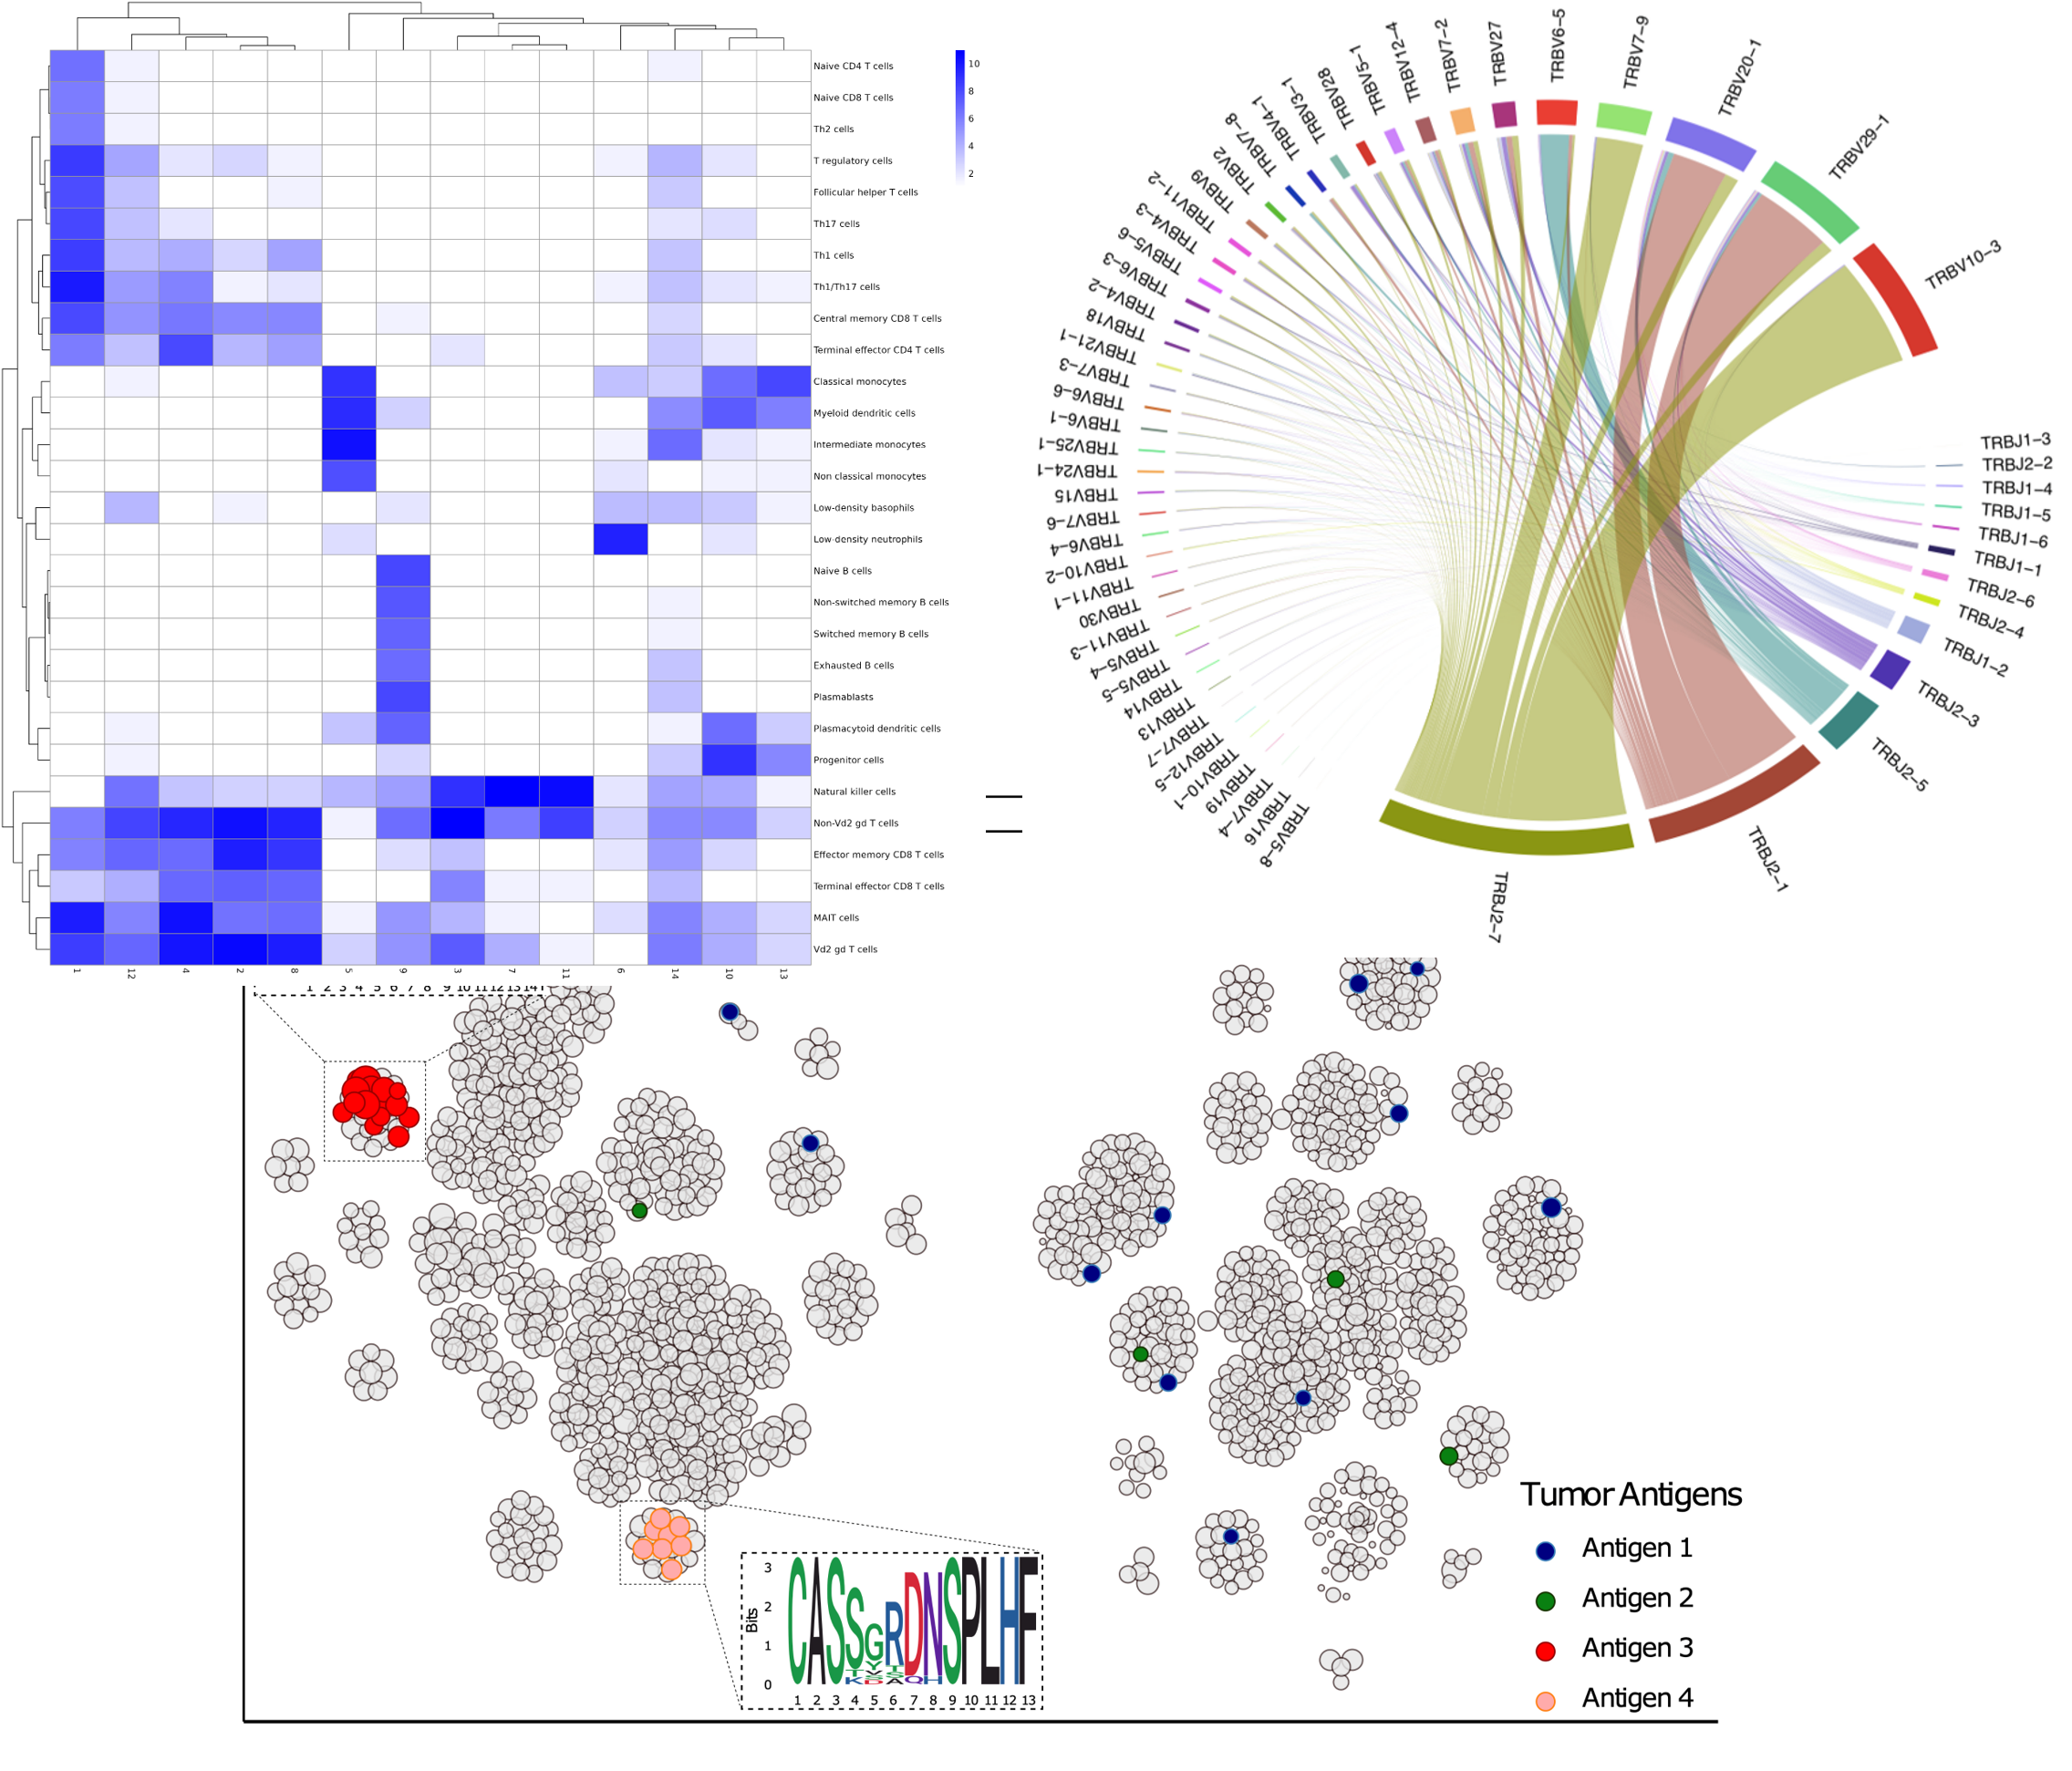
Combined with scRNAseq, we give your access to analysis such as clonal architecture, repertoire classification, clonal specificity inference (with internal data base).
Deliverables
Bioinformatics object, complemented by the analyses listed above and their relevant graphical representations.
Our regular pipelines offer QC, alignement, one selection and dimension reduction, for both protein data & transcriptomics
Deliverables
FastQ – QC reports – Filtered data.
Normalization, Gene Selection, Dimension reduction. (Advance calculation of the PCA, t-SNE and UMAP axes.)
Deliverables
Bioinformatics object (e.g. Seurat, SingleCellExperiment, …) including counting data, normalized data, integrated sample data, and reduction dimensions.
With advanced analysis, use our pipelines for cell analysis, markers associated with each cluster, ORA, correlation analysis between RNA & proteins…
Sample Batch Correction & Integration
Cell analysis
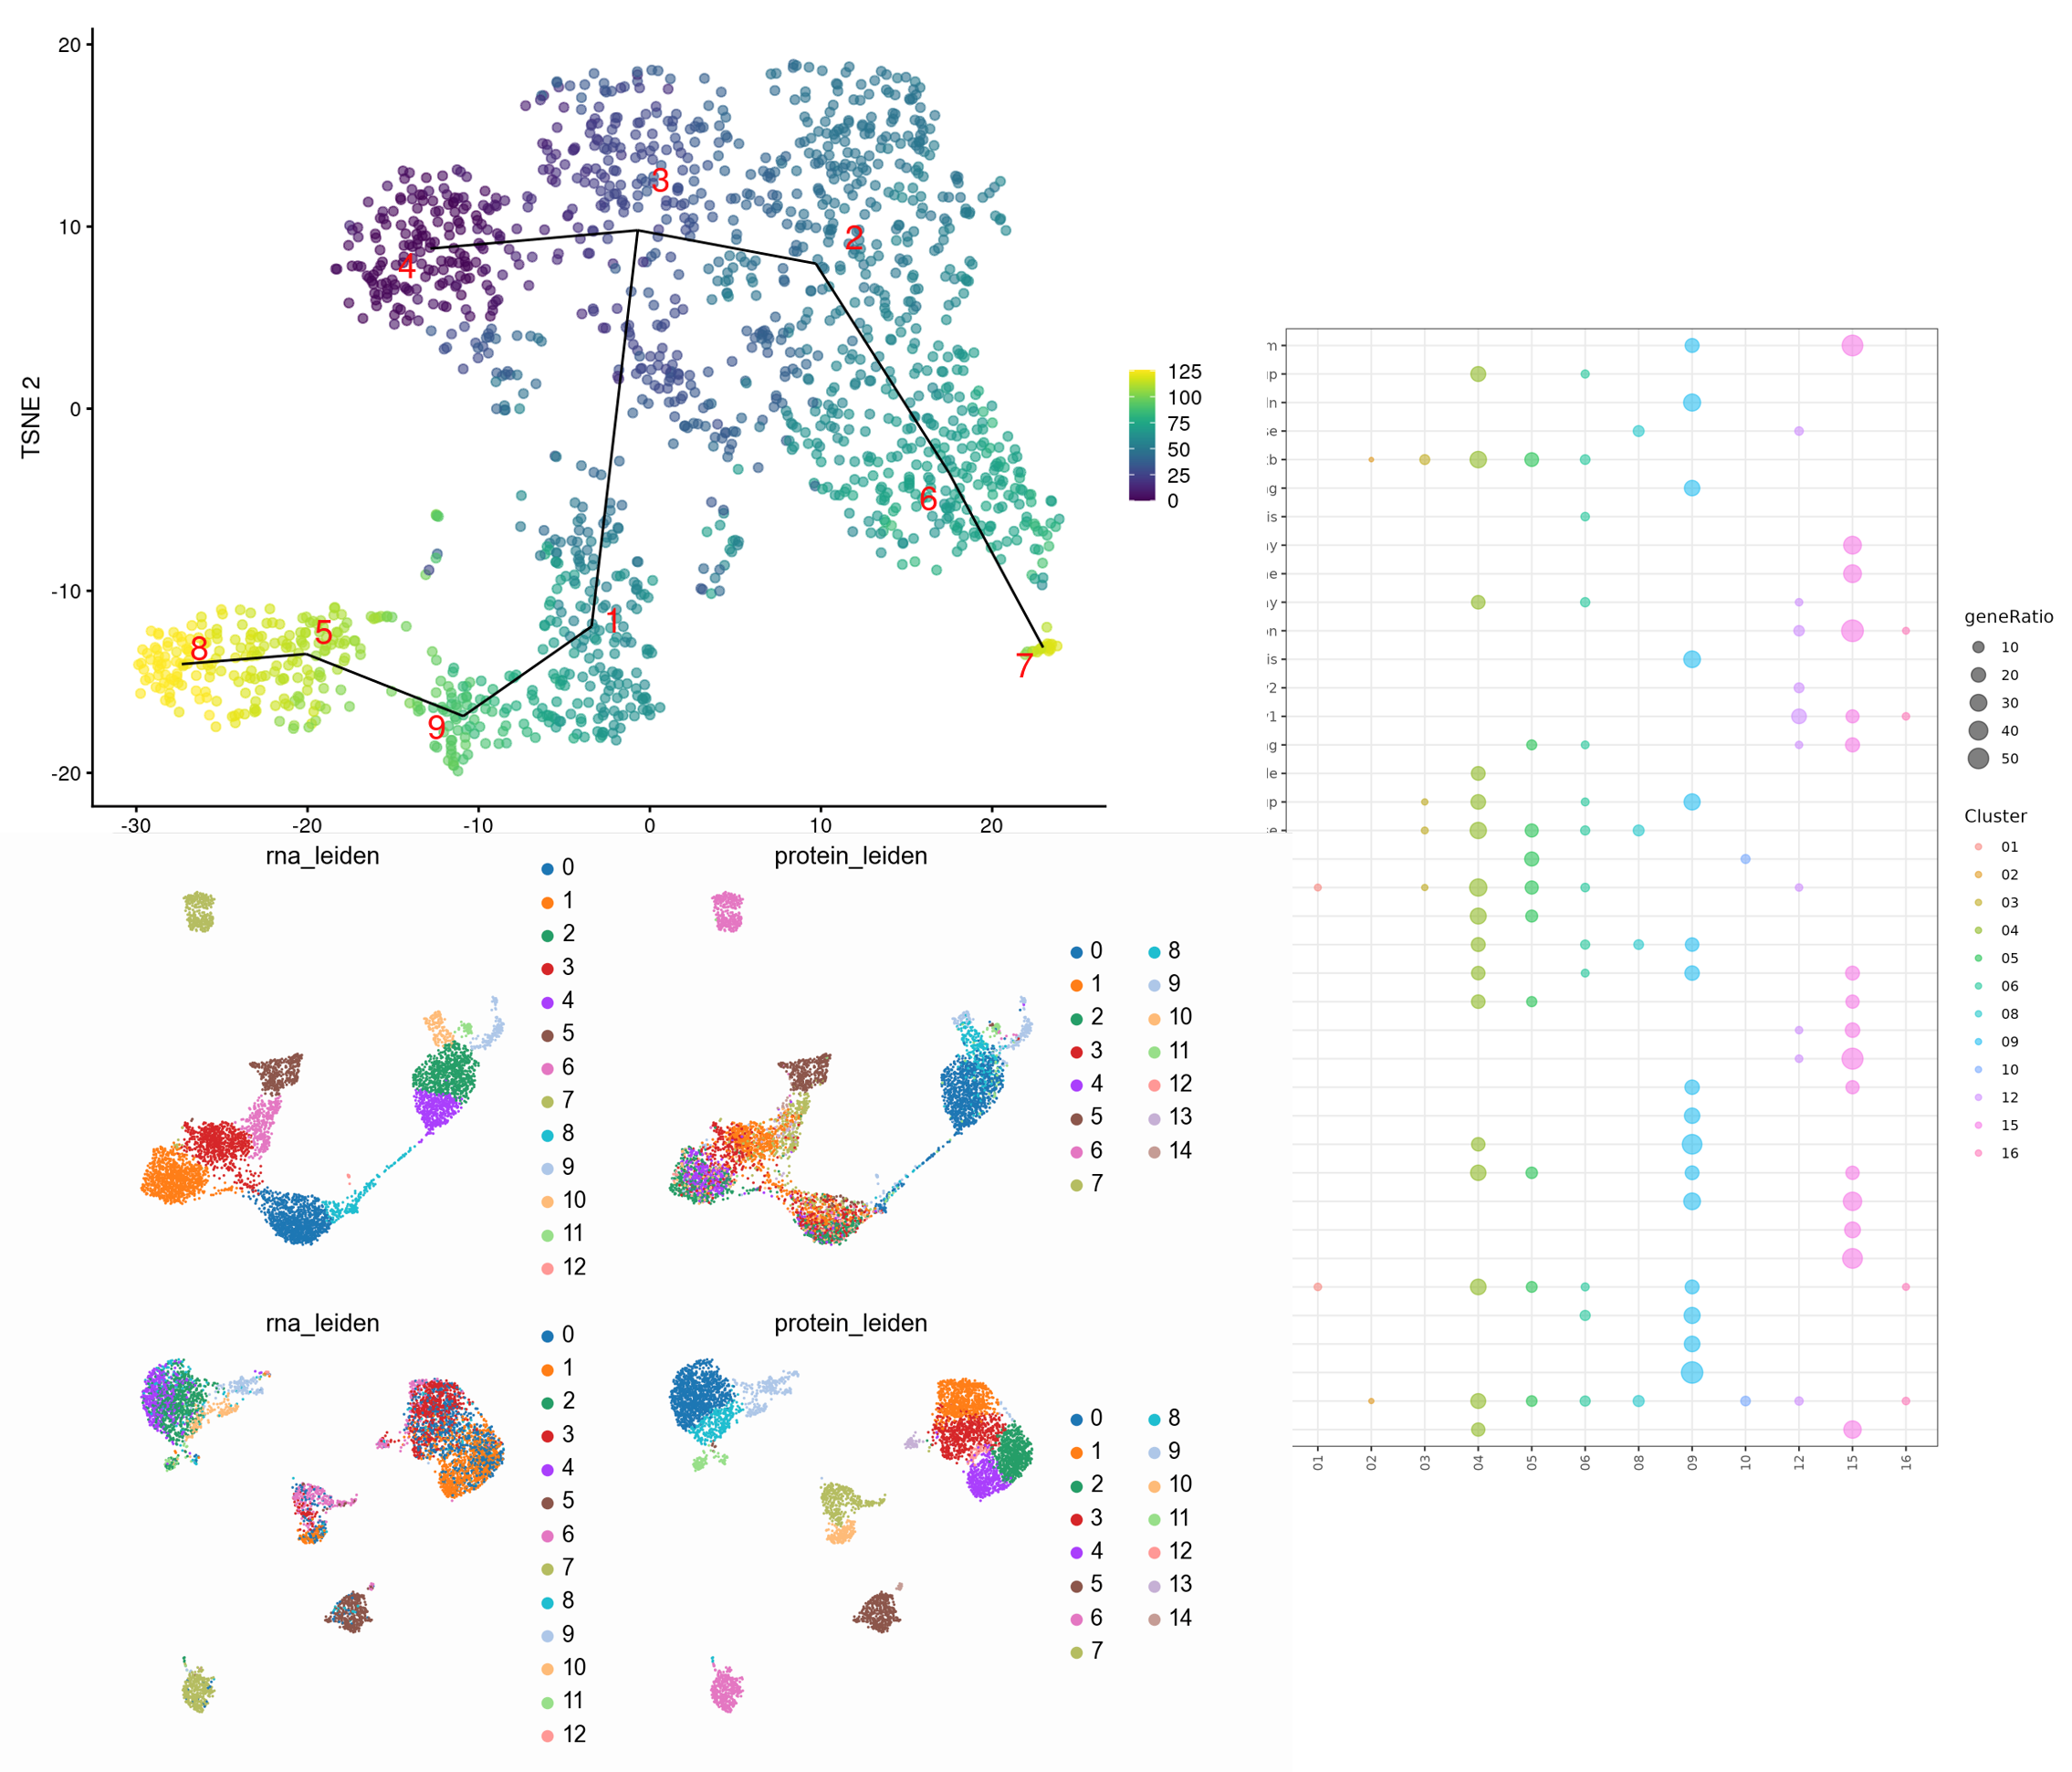
Identification of cell clusters by K-nearest neighbor (K-NN) graph and by the Leuven community detection method.
Identification of markers associated with each cluster
Differential tests between each cluster versus all cells.
ORA (over representation analysis)
Functional analysis of differentially expressed genes (e.g. representation of genes in databases such as KEGG (pathways) and/or in GO (ontologies).
Cluster Annotation
Predict the functions of each cluster based on predefined pathways, ontologies, and molecular signatures.
Correlation Analysis
Correlation between RNA and protein expression levels to identify genes that are translated into proteins and examine post-transcriptional regulation.
Graphical representation
volcano, heatmap, UMAP, gene networks,…
Deliverables
Previous bioinformatics object (e.g. Seurat, SingleCellExperiment, …), completed with the analyses listed above, differential and functional analysis tables, and figures.
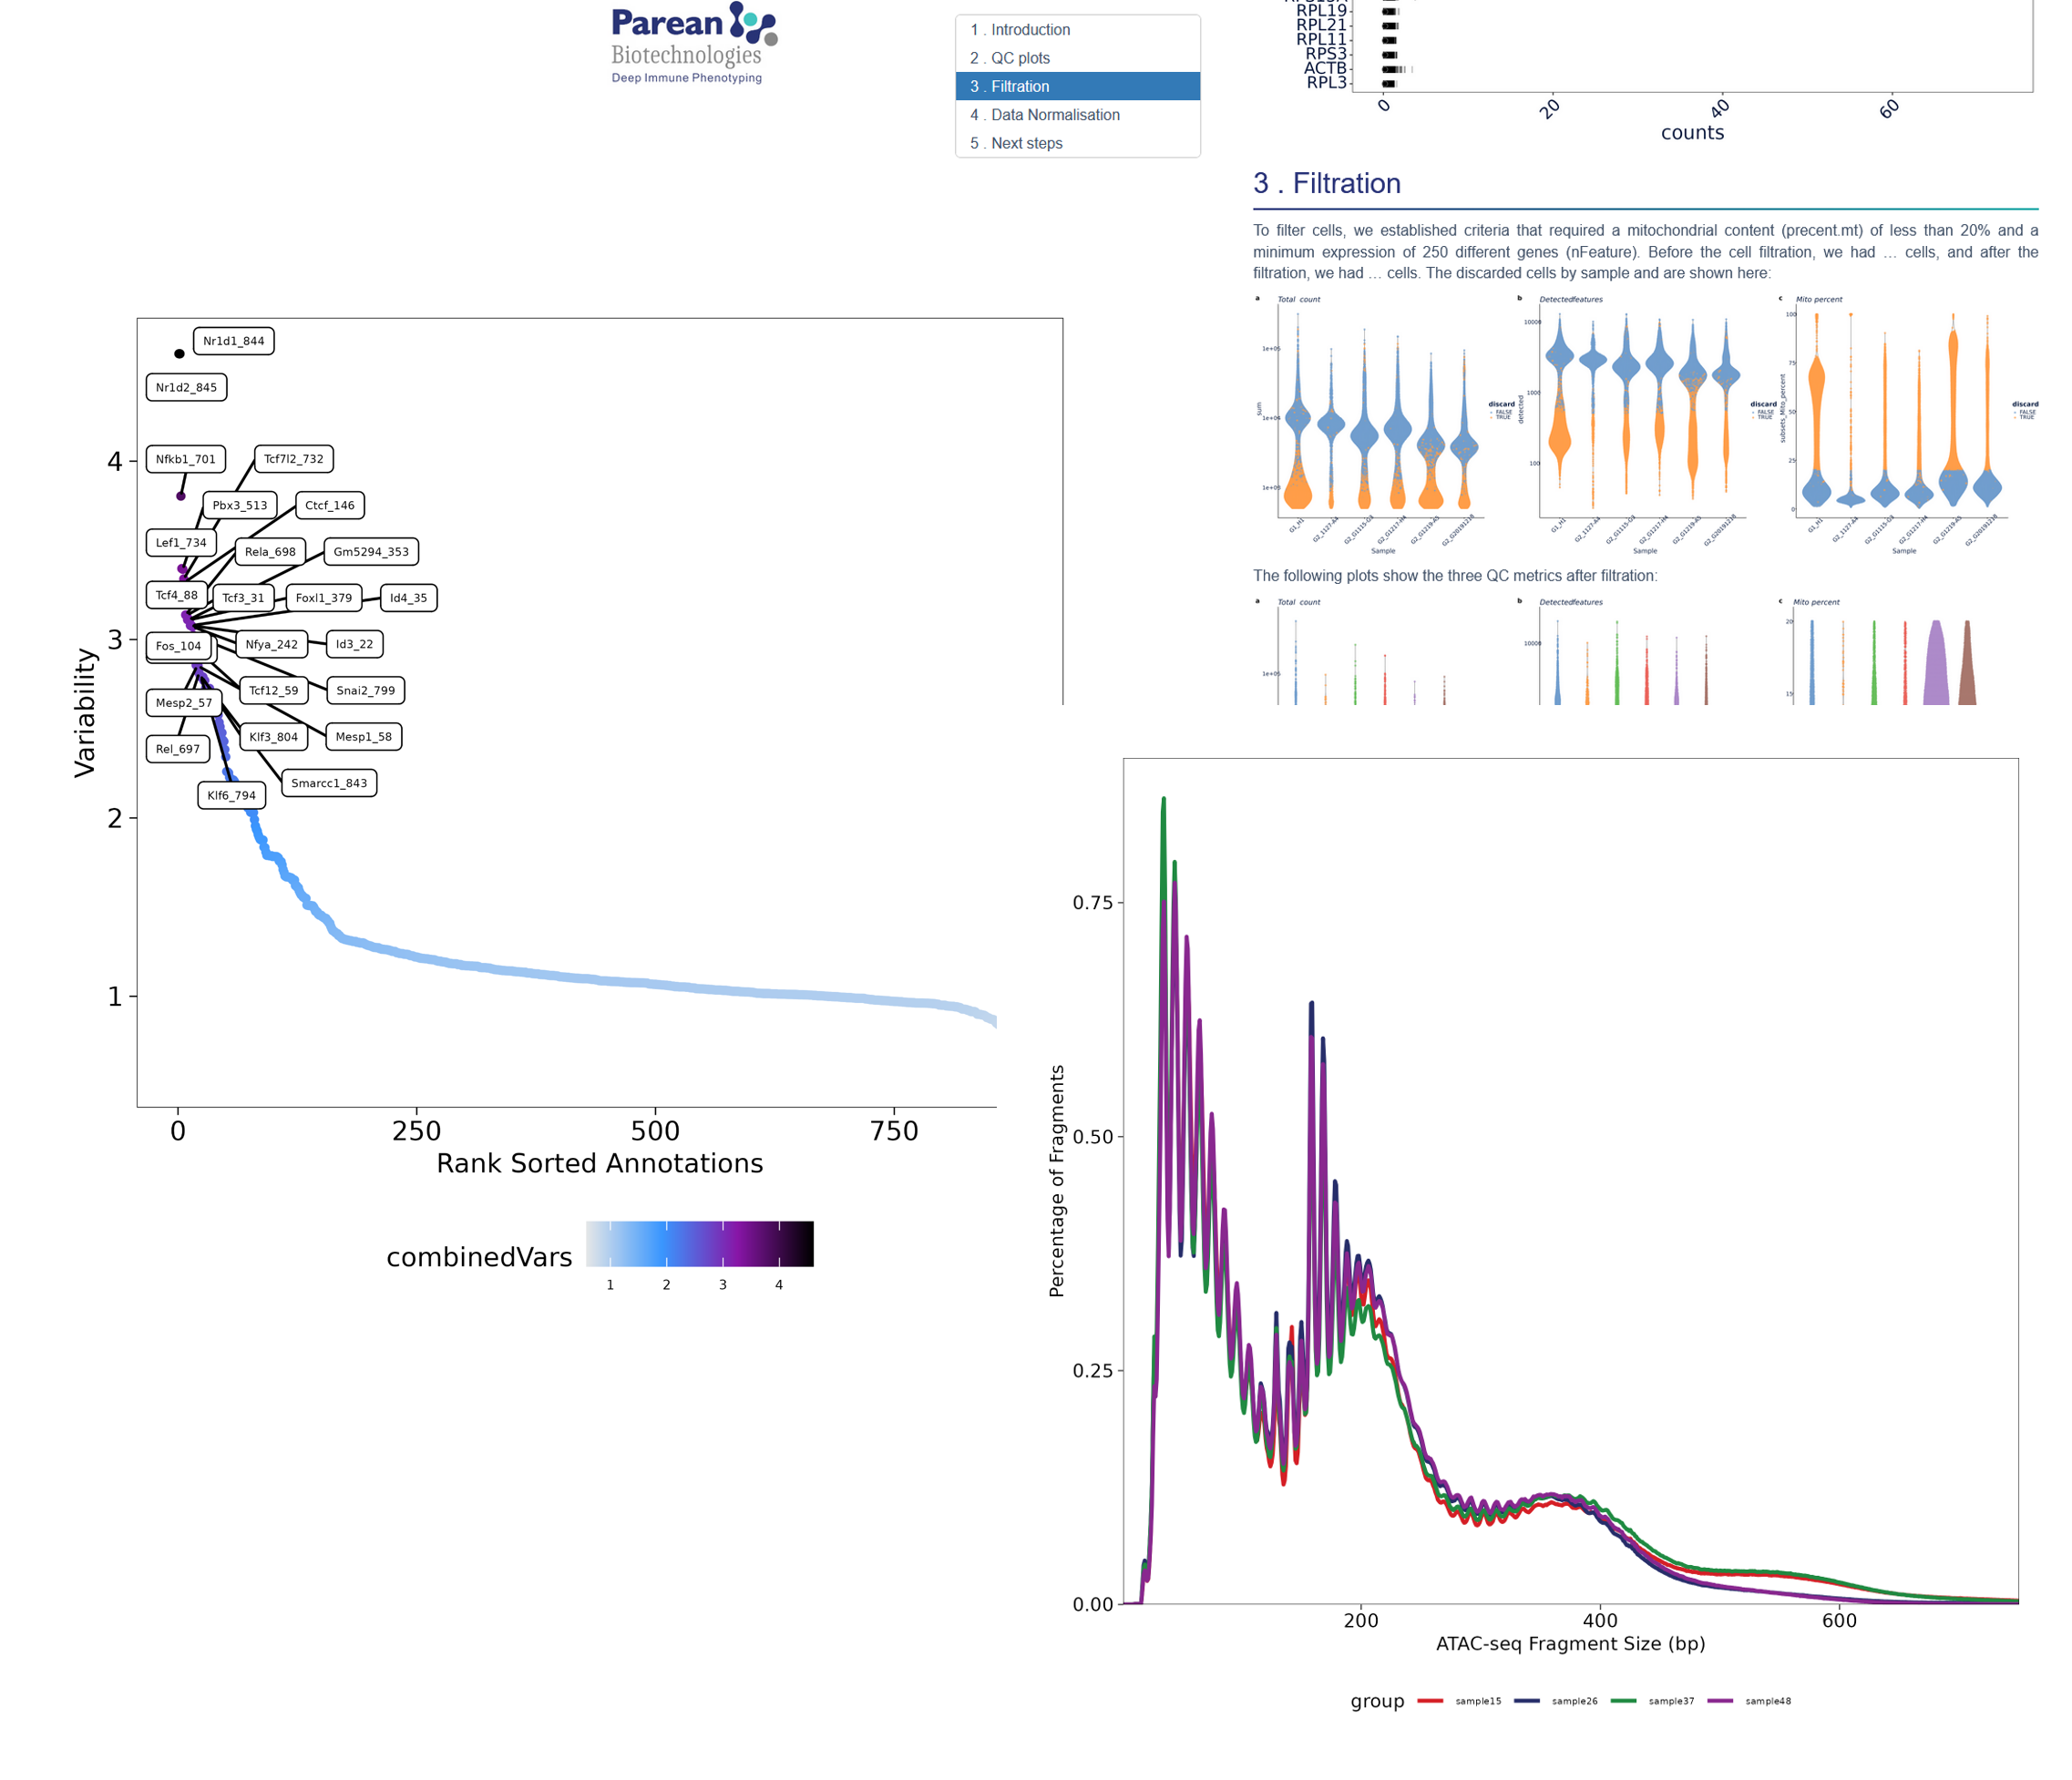
scATACseq data sets are difficult to analyse, even on pre processing or regular analysis. Use our pipelines for QC, peak calling, normalization, handle multi mapping & PCR ..
Our advanced pipelines enables clustering, differential accessibility analysis, Gene regulatory network analysis (ex SCENIC) or functional enrichment analysis.
principal component analysis (PCA) or t-distributed stochastic neighbor embedding (t-SNE) to visualize and explore the data.
chromatin accessibility profiles using methods such as k-means clustering, hierarchical clustering, or density-based clustering algorithms.
Known marker genes or reference datasets to identify different cell types (CellAssign, SingleR, or SCENIC for cell type annotation).
Differentially accessible regions (DARs) or peaks between different cell types or conditions using statistical tests like DESeq2, edgeR, or MAST.
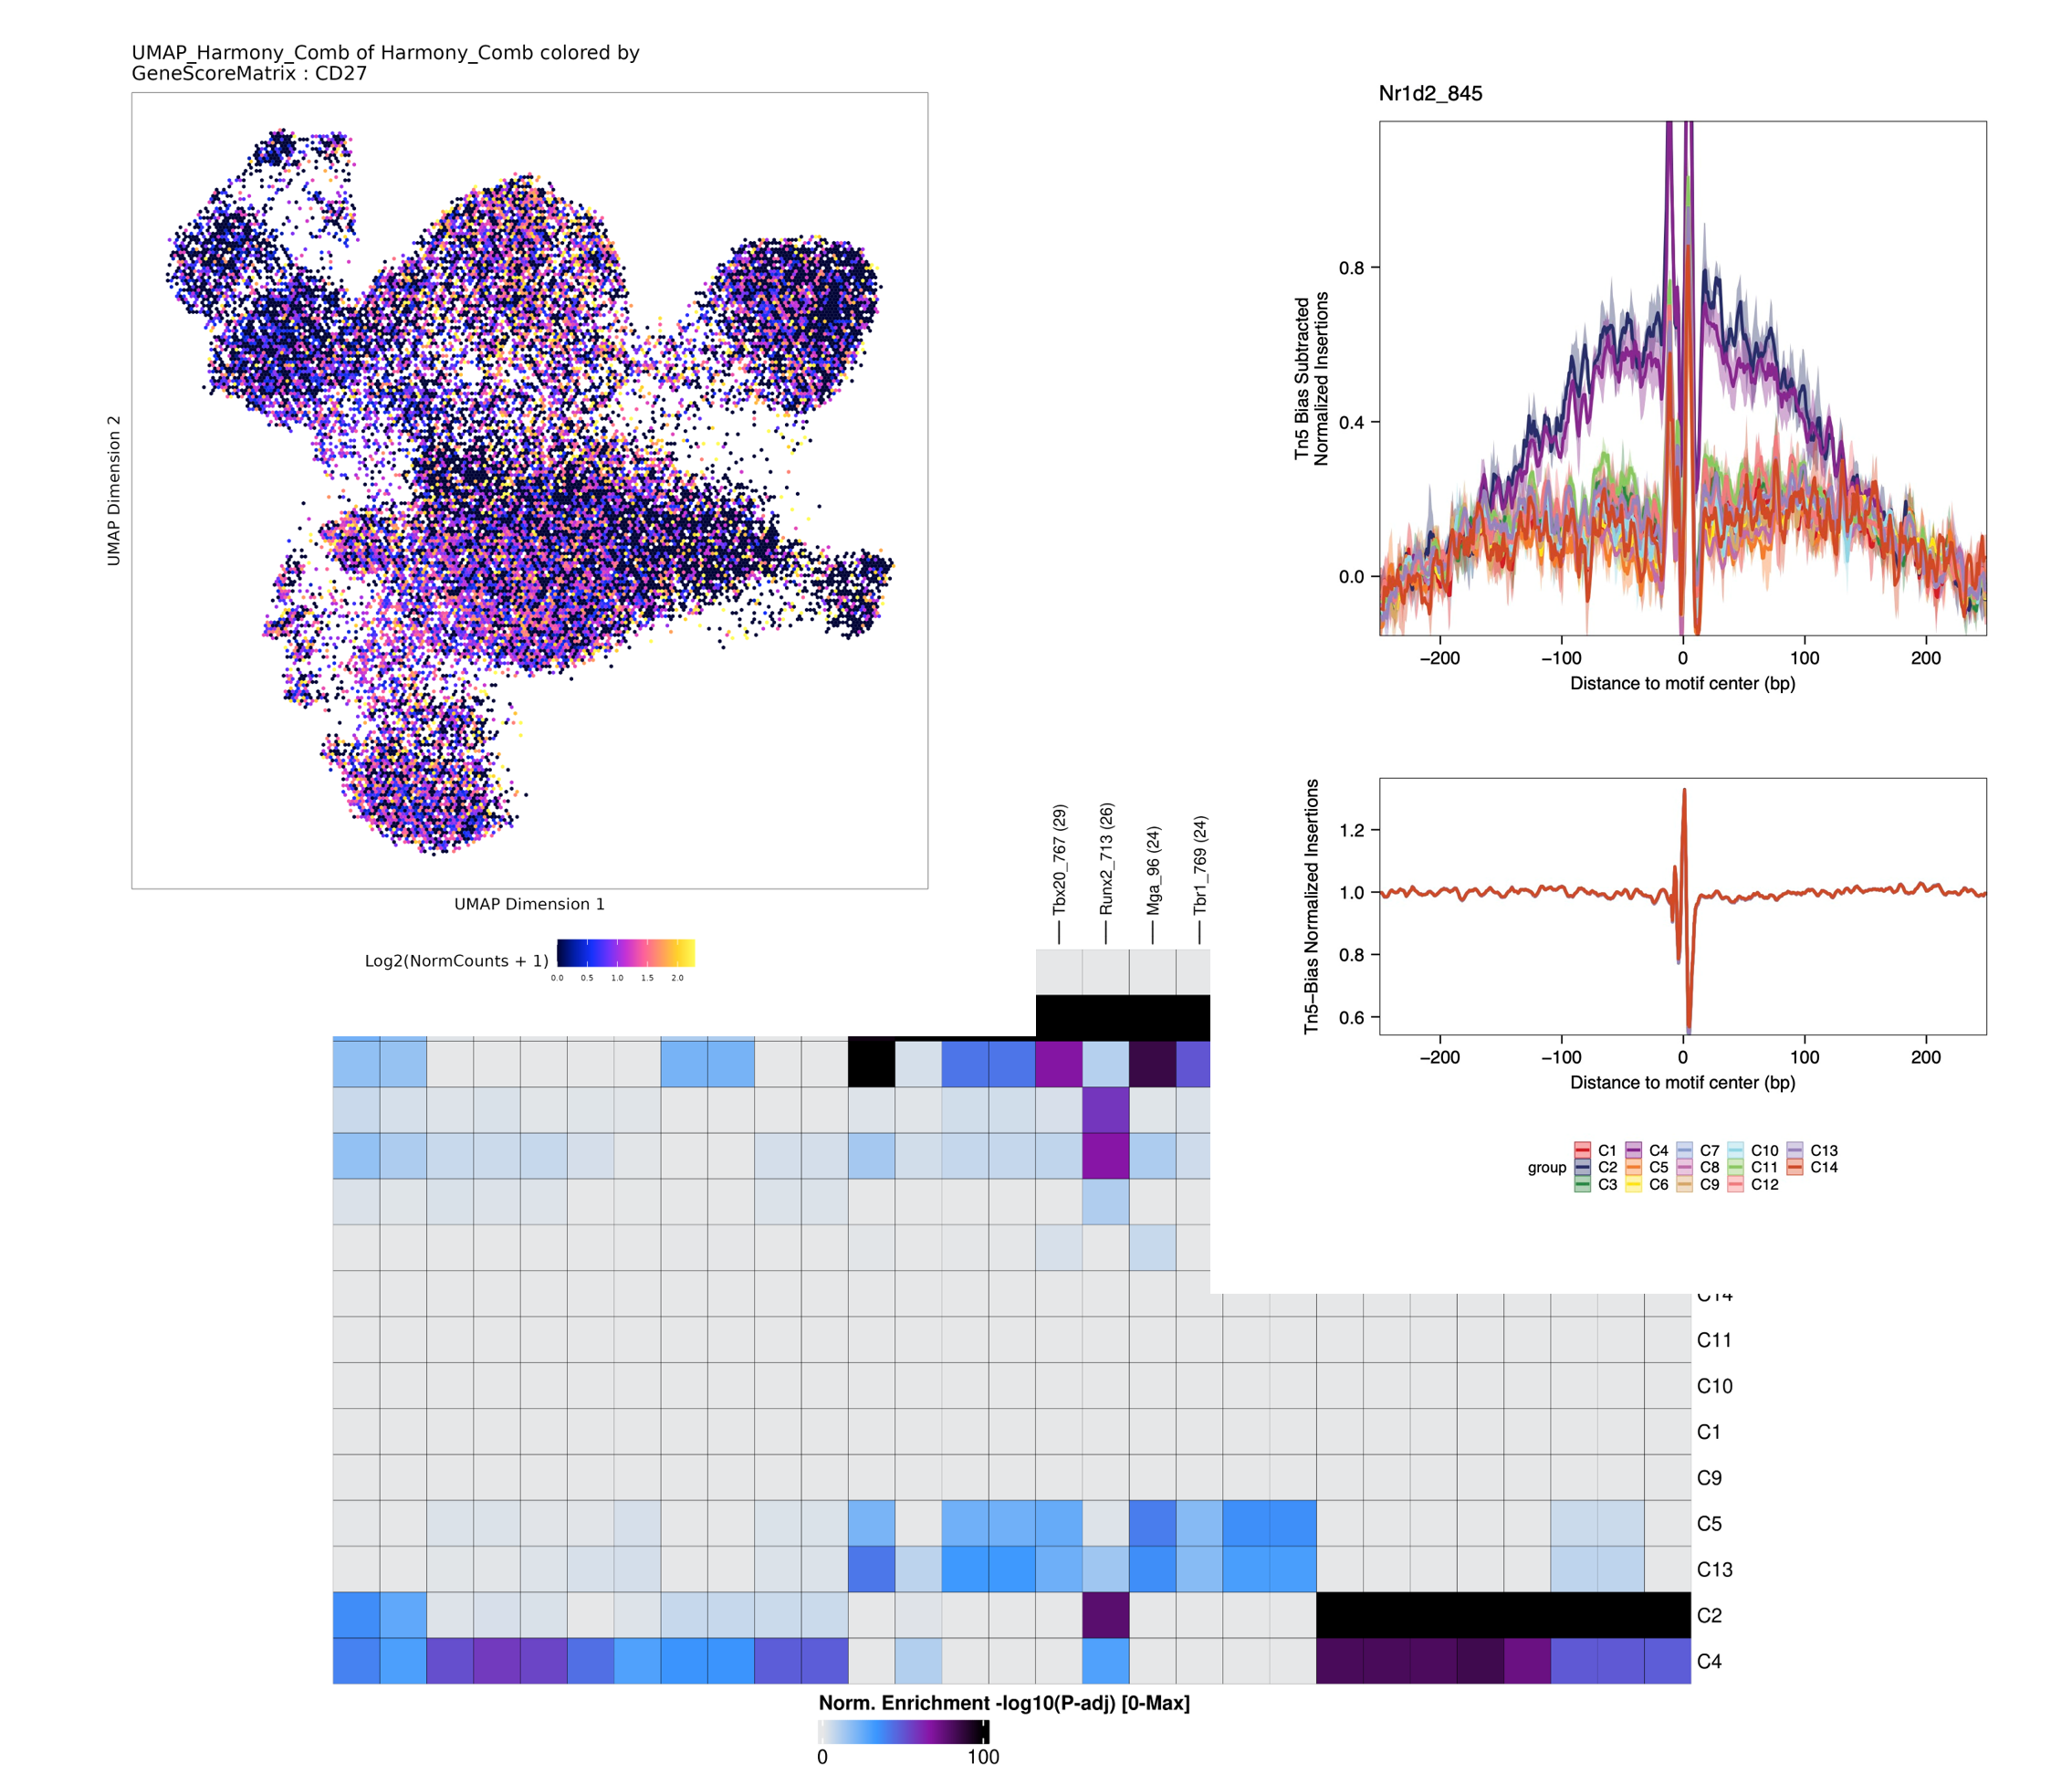
Infer gene regulatory networks (GRNs) from single-cell ATAC-seq data to elucidate transcriptional regulatory relationships using tools like SCENIC or Cicero.
Identify biological processes, pathways, or transcription factor binding motifs associated with differentially accessible regions.
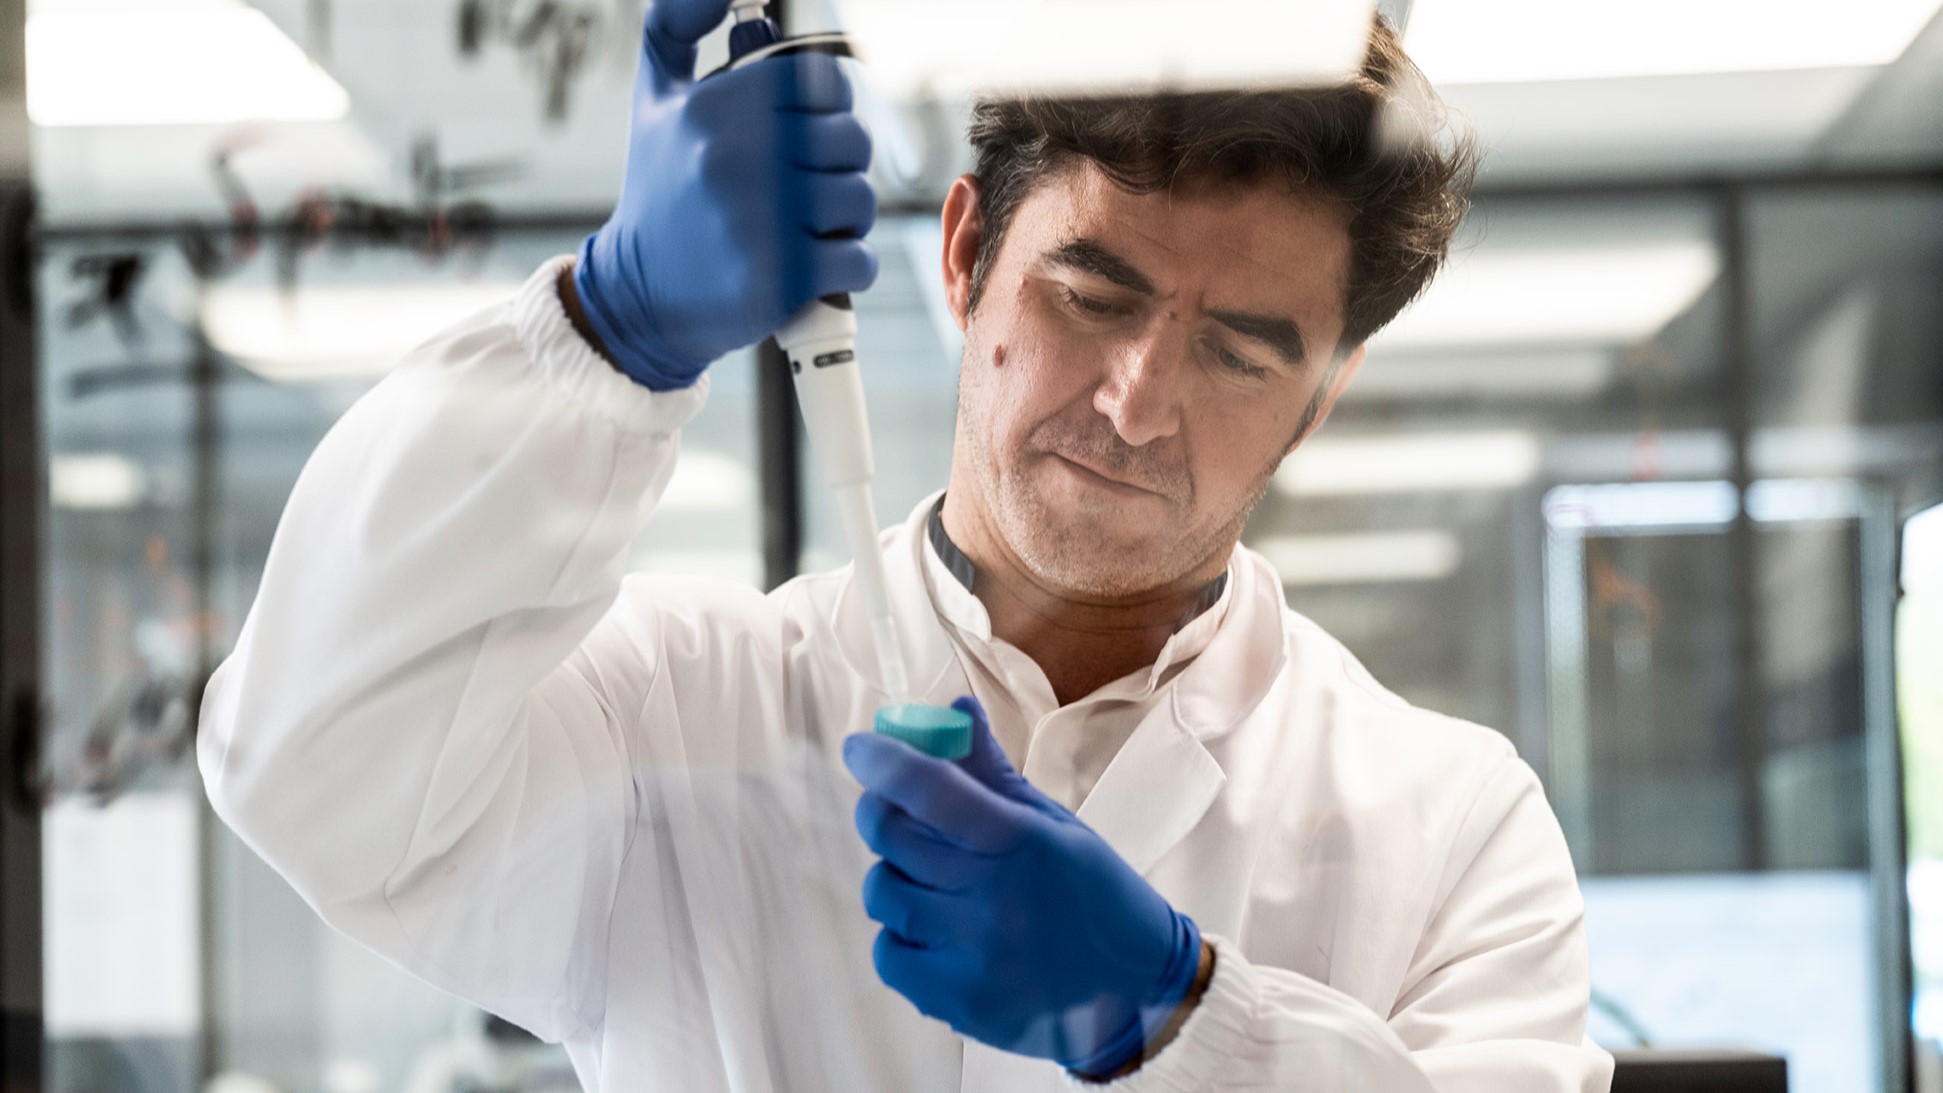
Integrated technological platform, dedicated to cell phenotyping, omics generation and data analysis.
Go to Wet Labs
Resident memory CD8+T cell subpopulations in patients with non-small-cell lung cancer
December 3, 2024
Journal for ImmunoTherapy of Cancer - 2024

Plasma CD27, a Surrogate of the Intratumoral CD27–CD70 Interaction, Correlates with Immunotherapy Resistance in Renal Cell Carcinoma
November 14, 2022
Clinical Cancer Research - 2022
10x Genomics Certification: Single Cell Immune Profiling
January 1, 2024
Single Cell Omics Wet Labs

Benchmarking of T cell Receptor repertoire profiling methods reveals large systematic biases
September 7, 2020
Nature Biotechnology - 2020
Parean x Keyrus: DataScience operations in EU and North America
November 7, 2022
DataScience for Pharmaceutical Companies
Long-lived central memory γδ T cells confer protection against murine cytomegalovirus reinfection
July 8, 2024
Plos Pathogens - 2024

